Code
# loading packages
library(readxl)
library(dplyr)
library(tidyr)
library(ggplot2)
library(lubridate)
library(here)# loading packages
library(readxl)
library(dplyr)
library(tidyr)
library(ggplot2)
library(lubridate)
library(here)# importing data
harassment_df <- read_excel(here("posts/mattea_post/harassment_restraining_data.xlsx"))
pop_df <- read_excel(here("posts/mattea_post/updated_pop.xlsx"))
#counties <- c("Hampshire", "Hampden", "Berkshire", "Franklin")
#harassment_df <- filter(harassment_df, County %in% counties)
#pop_df <- pop_df |> select(-c(1,2)) #cleaning harassment data and putting into format of county and year total case filings
harassment_summary <- harassment_df |> mutate(`Number of Filings` = as.numeric(`Number of Filings`)) |> group_by(County, `Fiscal Year`, `Order Type`) |> summarise(total_filings = sum(`Number of Filings`, na.rm=TRUE), .groups="drop")# trying to put the pop df into a format which can eventually be merged with the harassment data
pop_clean <- pop_df |> select(-c(`DOR Code`, Municipality))
pop_long <- pop_clean |>
pivot_longer(cols = -County, names_to = "Fiscal Year", values_to = "Population") |>
mutate(`Fiscal Year` = as.numeric(`Fiscal Year`)) |>
group_by(County, `Fiscal Year`) |>
summarise(Population = sum(Population, na.rm = TRUE), .groups = "drop")# try9ng to combine the data
# starting by ensuring compatibility
harassment_summary <- harassment_summary |> mutate(County = toupper(County))
harassment_summary <- filter(harassment_summary, `Fiscal Year` >= 2012, `Fiscal Year` <= 2023)
harassment_combined <- harassment_summary |>
group_by(County, `Fiscal Year`) |>
summarise(total_filings = sum(total_filings, na.rm = TRUE), .groups = "drop")# joining
merged_df <- harassment_combined |> inner_join(pop_long, by = c("County", "Fiscal Year")) |> mutate(Crude_Rate = (total_filings / Population) * 100000) # a crude rate per 10000 people in each county, sd not every county has more than or even 1000,000 people Last year, 19 people were murdered by an intimate partner in Massachusetts alone.
According to Jane Doe Inc. – a coalition against intimate partner violence (IPV) and sexual assault in Massachusetts – despite having one the lowest percentages of domestic violence reporting in the country, Massachusetts saw an average of 18 intimate partner homicides each year for the last decade. Compared to an annual average of about 133 homicides statewide between 2012 and 2022, intimate partner homicides constitute a significant proportion of violent deaths in Massachusetts.
IPV spans the entire state. However, official data on restraining and harassment order case filings from 2012-2023 released by the Massachusetts Court System, combined with county level population data for the same time period reveals disparities in the rates at which people seek protective orders – a key step to preventing these homicides and a potential signifier of the prevalence of domestic violence.
These disparities are especially present in the crude rates (cases divided by the population and then multiplied by the same number to account for size differences, in this case out of every 10,000 residents) of protective orders at the county level, particularly in Western Massachusetts.
ggplot(merged_df, aes(x = `Fiscal Year`, y = Crude_Rate, colour=County)) +
  geom_line() +
  scale_size_continuous(range = c(4, 10)) +
  labs(title = "Crude Rate of Restraining Orders by County",
       x = "Year",
       y = "Crude Rate (per 10,000)") +
  theme_minimal() +
theme(axis.text.x = element_text(angle = 45, hjust = 1)) 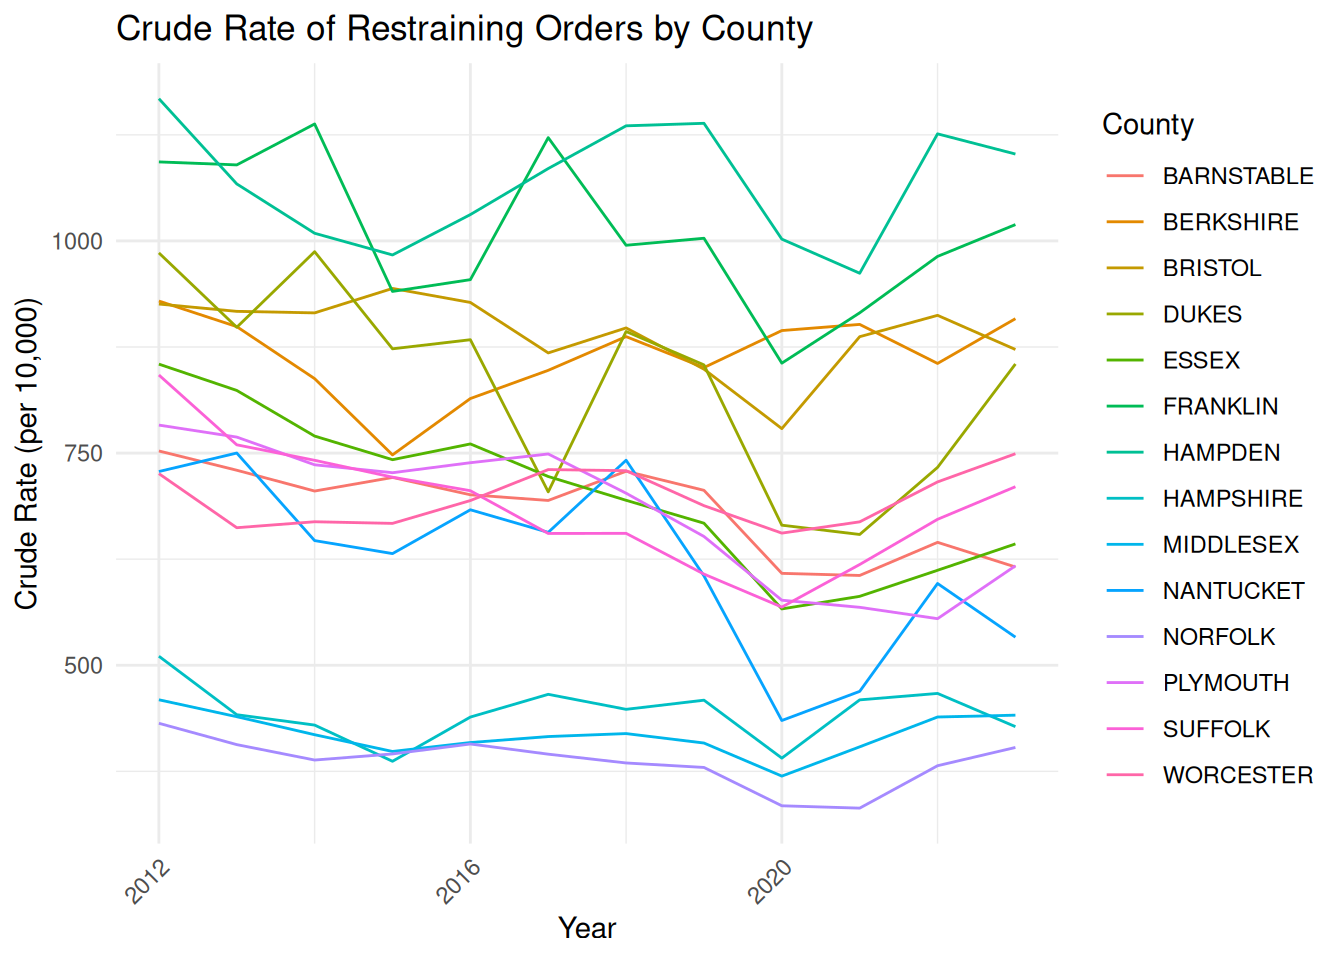
The crude rate of protective order filing in Franklin county (and Hampden county) was about 2:1 compared to Hampshire county every year between 2012 and 2023. This means that, despite having a population which is under half of Hampshire’s, people in Franklin county were seeking protective orders at at least twice the rate of Hampshire residents. A few years saw filing rates over 2.5 times greater in Franklin than in Hampshire.
While the actual numbers of cases filed are low, and the relative proportion of the population filing these orders is also small, the fact that such a large difference exists between these two neighboring counties should make us wonder why this inequality in protective order filings exists.
One potential reason for the discrepancy in these rates lies in the rural nature of Franklin county and the resulting barriers to accessing domestic violence prevention resources. Franklin county is the most rural county in Massachusetts in terms of population density. Research shows that women living in isolated areas report experiencing IPV at higher rates than women in urban areas, and often struggle to access resources meant to support them.
MassGov lists 2 official IPV resources for Franklin county, one of which is actually in Hampshire country (Northampton) and one in Greenfield. About three quarters of Franklin’s residents live outside of Greenfield. Given the rurality of the county itself, accessing these two sources – one of which is an up to 30 minute car ride or a longer bus commute from the other – could pose a serious challenge for those seeking support outside of the court system. People without cars and those who need extra discretion are particularly vulnerable.
Hampshire county’s reported 5 official resources, on the other hand, are spread more evenly throughout the denser county, which could allow residents to access non-legal assistance such as safe housing. As a result, victims of IPV in Franklin county who are unable to access efficient non-legal or community support may rely on court ordered protections more often, leading to higher filing rates.
Official data on the granting of protective orders or results of domestic violence cases are not available online, making it difficult to determine the efficacy of community and local responses to domestic violence in the counties. However, it is clear that people facing IPV in certain parts of Western Massachusetts are interacting quite differently with the legal system when compared to their neighbors, representing a potential opportunity for future intervention efforts.